


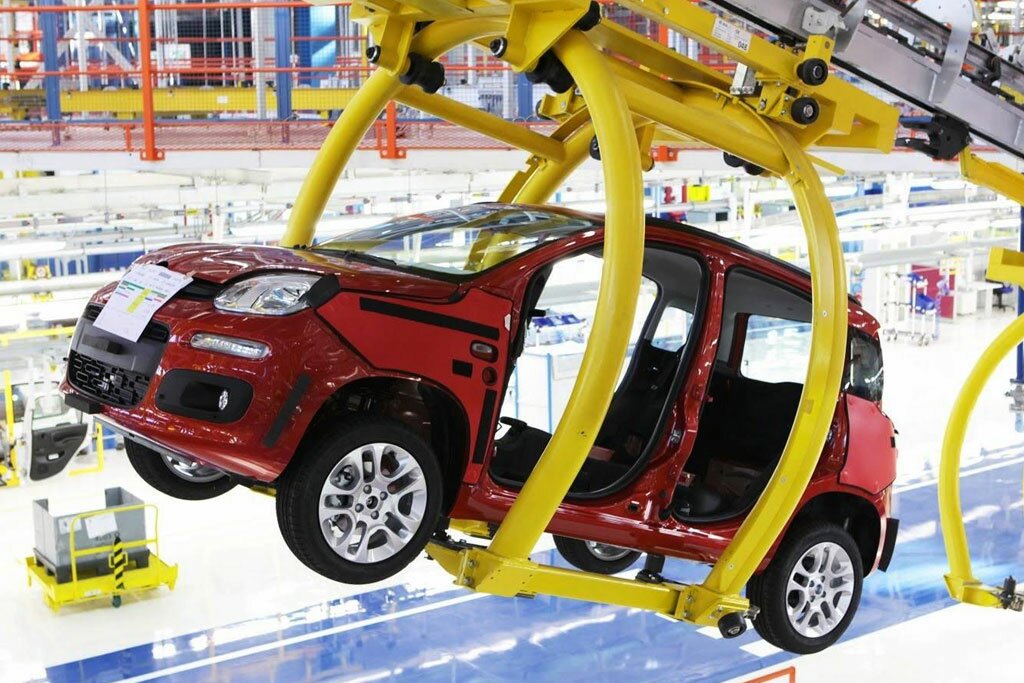
Compact Panda, however, is still the best seller with leftovers
New vehicle sales in Italy started 2019 at a slow pace. The 164.864 units registered in January represented a 7,5% drop compared to the same period in 2018. This negative result was strongly influenced by Fiat's momentum.
Leader among automakers, the Italian brand registered 24.445 units last month, almost 30% less than a year ago, and reached just 14,8% market share, the lowest in its history according to Best Selling Cars Blog. This was the 14th consecutive month with negative numbers for Fiat.
With this, Volkswagen (14.865) reduced its disadvantage compared to its rival to less than 10 thousand units, compared to more than 21 thousand units at the beginning of 2018. Highlights from the top 10, Dacia (7.728) and Lancia/Chrysler (6.606) grew by more than 25%.
Unsurprisingly, the Fiat Panda (14.638) remained at the top of the Italians' list, followed by the Lancia Ypsilon (6.606). Showing that the new generation pleased the European market, the Citroën C3 (4.216) secured its presence on the podium. But it wasn't easy: with 4.137 units, the VW T-Roc equaled the 4th place recorded in September, its best position until then.
The Toyota Yaris (4.112), which is different from the model sold in Brazil, completed the top 5. Ahead of the VW Polo (3.805), the Dacia Duster (3.923) was in sixth place, its new positioning record. In fact, the Romanian brand barely managed to place two models in the top ten for the first time, as the Sandero (3.224) was stuck behind the Peugeot 208 (3.341).
Negative highlight, Fiat's 500 line lost space: while the 500X (3.410) lost more than 40% of its buyers in the last twelve months, the small 500 (2.183) retreated almost 60% and was outside the top 20. 15th, the Ford Ecosport (2.632) practically doubled sales. The new Mercedes A-Class (1.764), up more than 70%, was ahead of the VW up! (1.761).
| POS. | MODEL | JAN. 19 | JAN. 18 | %VAR. 19/18 | % MARKET |
| 1 | FIAT PANDA | 14.638 | 11.237 | 30,3% | 8,9% |
| 2 | LANCIA YPSILON | 6.606 | 4.250 | 55,4% | 4,0% |
| 3 | CITROËN C3 | 4.216 | 4.829 | -12,7% | 2,6% |
| 4 | VW T-ROC | 4.137 | 1.015 | 307,6% | 2,5% |
| 5 | TOYOTA YARIS | 4.112 | 3.725 | 10,4% | 2,5% |
| 6 | DACIA DUSTER | 3.923 | 3.389 | 15,8% | 2,4% |
| 7 | VW POLO | 3.805 | 3.618 | 5,2% | 2,3% |
| 8 | RENAULT CLIO | 3.792 | 3.945 | -3,9% | 2,3% |
| 9 | FIAT 500X | 3.410 | 5.734 | -40,5% | 2,1% |
| 10 | PEUGEOT 208 | 3.341 | 3.401 | -1,8% | 2,0% |
| 11 | DACHA SANDERO | 3.224 | 2.368 | 36,1% | 2,0% |
| 12 | JEEP COMPASS | 2.979 | 3.674 | -18,9% | 1,8% |
| 13 | JEEP RENEGADE | 2.963 | 3.553 | -16,6% | 1,8% |
| 14 | FORD FIESTA | 2.692 | 5.388 | -50,0% | 1,6% |
| 15 | FORD ECOSPORT | 2.632 | 1.321 | 99,2% | 1,6% |
| 16 | NISSAN QASHQAI | 2.557 | 2.997 | -14,7% | 1,6% |
| 17 | PEUGEOT 3008 | 2.502 | 1.946 | 28,6% | 1,5% |
| 18 | VAUXHALL CORSA | 2.421 | 1.952 | 24,0% | 1,5% |
| 19 | PEUGEOT 2008 | 2.265 | 2.232 | 1,5% | 1,4% |
| 20 | VW GOLF | 2.227 | 3.431 | -35,1% | 1,4% |
| 21 | FIAT 500 | 2.183 | 5.263 | -58,5% | 1,3% |
| 22 | OPEL KARL | 2.104 | 1.671 | 25,9% | 1,3% |
| 23 | CITROËN C3 AIRCROSS | 2.092 | 1.268 | 65,0% | 1,3% |
| 24 | RENAULT CAPTUR | 2.032 | 2.233 | -9,0% | 1,2% |
| 25 | OPEL CROSSLAND X | 2.000 | 1.331 | 50,3% | 1,2% |
| 26 | VW TIGUAN | 1.846 | 2.778 | -33,5% | 1,1% |
| 27 | MERCEDES CLASS A | 1.764 | 1.002 | 76,0% | 1,1% |
| 28 | VW UP! | 1.761 | 1.263 | 39,4% | 1,1% |
| 29 | FIAT TIPO | 1.687 | 5.215 | -67,7% | 1,0% |
| 30 | PEUGEOT 308 | 1.659 | 1.682 | -1,4% | 1,0% |
| POS. | BRAND | JAN. 19 | JAN. 18 | %VAR. 19/18 | % MARKET |
| 1 | FIAT | 24.445 | 34.530 | -29,2% | 14,8% |
| 2 | VOLKSWAGEN | 14.865 | 13.441 | 10,6% | 9,0% |
| 3 | PEUGEOT | 11.346 | 10.904 | 4,1% | 6,9% |
| 4 | FORD | 11.152 | 12.557 | -11,2% | 6,8% |
| 5 | OPEL | 9.638 | 8.724 | 10,5% | 5,8% |
| 6 | CITROEN | 8.959 | 8.803 | 1,8% | 5,4% |
| 7 | RENAULT | 8.213 | 9.526 | -13,8% | 5,0% |
| 8 | TOYOTA | 8.100 | 8.185 | -1,0% | 4,9% |
| 9 | DACIA | 7.728 | 6.147 | 25,7% | 4,7% |
| 10 | LANCIA / CHRYSLER | 6.606 | 4.252 | 55,4% | 4,0% |
| 11 | JEEP/DODGE | 6.249 | 7.452 | -16,1% | 3,8% |
| 12 | BMW | 4.894 | 4.836 | 1,2% | 3,0% |
| 13 | MERCEDES-BENZ | 4.845 | 4.812 | 0,7% | 2,9% |
| 14 | KIA | 4.439 | 4.064 | 9,2% | 2,7% |
| 15 | NISSAN | 4.104 | 6.461 | -36,5% | 2,5% |
| 16 | AUDI | 4.087 | 6.515 | -37,3% | 2,5% |
| 17 | HYUNDAI | 3.554 | 4.031 | -11,8% | 2,2% |
| 18 | SUZUKI | 3.388 | 3.374 | 0,4% | 2,1% |
| 19 | ALFA ROMEO | 2.473 | 4.525 | -45,3% | 1,5% |
| 20 | SKODA | 2.027 | 2.270 | -10,7% | 1,2% |
| ... | ... | ... | ... | ... | ... |
| TOTAL | 164.864 | 178.326 | -7,5% | 100,0% |
Sources: UNRAE / Best Selling Cars Blog